Τα διαγράμματα έγιναν, τα συμπεράσματα είναι προφανή. Βαίνουμε προς το τέλος.
Υπολογίζουμε σε κάθε υποερώτημα τη συχνότητα των απαντήσεων (ποσοστιαία) και στην τελική αναφορά στο κάθε συμπέρασμα αναφέρουμε και το ποσοστό.
Γράφουμε την αναφορά μας ελληνικά και αγγλικά.
Τέλος σχεδιάζουμε και εκτυπώνουμε τα εξώφυλλα που θα "ντύσουν" την εργασία μας.
Πέμπτη 28 Ιανουαρίου 2010
Τετάρτη 27 Ιανουαρίου 2010
Τρίτη 26 Ιανουαρίου 2010
Question 5


Conclusion: We come to the conclusion that 80% of greek people think that seals are the animals that face the danger of extinction more than any other sea animal. On the other hand, 21.21% of citizens from european countries believe that whales are the most endangered spieces of sea.
Created by: Marina Denelava & Evagelia Gergatsouli
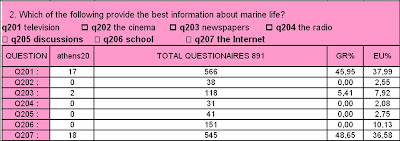
Question 2


Conclusion: We came to the conclusion that the Internet is the best way to inform people 48,95 for the GREEKS and 36,58
for the EUROPEAN. Also the Television 45,95 for rhe GREEKS and 37,99 for the EUROPEANS.
for the EUROPEAN. Also the Television 45,95 for rhe GREEKS and 37,99 for the EUROPEANS.
Created by: Gianna Kapourani
Question 1
Τρίτη 12 Ιανουαρίου 2010
Step 7: Diagrams

Ήρθε επιτέλους η ώρα να επεξεργαστούμε τα ερωτηματολόγια και να δούμε τα αποτελέσματα.
Το αρχείο Excel (click to download), που αποτελεί τη πηγή με τις απαραίτητες πληροφορίες, έτοιμες για επεξεργασία βρίσκεται στον ιστοχώρο του γαλλικού σχολείου (http://v2cl.free.fr/) και μας περιμένει...
Ο κάθε μαθητής θα αναλύσει μια ερώτηση, θα σχεδιάσει τα γραφήματα με τη βοήθεια του excel, θα φτιάξει την παρουσίασή του με τη χρήση του Power Point και στο τέλος θα γράψει την αναφορά του με τα συμπεράσματα, χρησιμοποιώντας το Word.
Τέλος θα φτιάξει το εξώφυλλο της εργασίας του με κάποιο σχεδιαστικό πακέτο .
Τί αποκλίσεις είχαμε στις απαντήσεις Ελλήνων και Ευρωπαίων;
Εγγραφή σε:
Αναρτήσεις (Atom)


